
Mile
Zero
July 18, 2024
A Letter to Fellow Data Journalists about "AI"
We need to talk, friends. Things have gotten weird out there, and you're not dealing with it well at all.
I'm in a lot of data journalist social spaces, and a couple of years ago I started to notice a lot of people starting to use large language models for things that, bluntly, didn't make any sense. For example, in response to a question about converting between JSON and CSV, someone would inevitably pipe up and say "I always just ask ChatGPT to do this," meaning that instead of performing an actual transfer between two fully machine-readable and well-supported formats, they would just paste the whole thing into a prompt window and hope that the statistics were on their side.
I thought this was a joke the first time I saw it. But it happened again and again, and gradually I realized that there's an entire group of people — particularly younger reporters — who seem to genuinely think this is a normal thing to do, not to mention all the people relying on LLM-powered code completion. Amid the hype, there's been a gradual abdication of responsibility to "ChatGPT said" as an answer.
The prototypical example of this tendency is Simon Willison, a long-time wanderer across the line between tech and journalism. Willison has produced a significant amount of public output since 2020 "just asking questions" about LLMs, and wrote a post in the context of data journalism earlier this year that epitomizes both the trend of adoption and the dangers that it holds:
- He demonstrates a plugin for his Datasette exploration tool that uses an LLM to translate a question in English into a SQL query. "It deliberately makes the query visible, in the hope that technical users might be able to spot if the SQL looks like it's doing the right thing," he says. This strikes me as wildly optimistic: since joining Chalkbeat, I write SQL on a weekly basis, collaborating with a team member who has extensive database experience, and we still skip over mistakes in our own handwritten queries about a third of the time.
- Generally, the queries that he's asking the chatbot to formulate are... really simple? It's all SELECT x, y FROM table GROUP BY z in terms of complexity. These kinds of examples are seductive in the same way that front-end framework samples are: it's easy to make something look good on the database equivalent of a to-do app. They don't address the kind of architectural questions involved in real-world problems, which (coincidentally) language models are really bad at answering.
- To his credit, Simon points out a case in which he tried to use an LLM to do OCR on a scanned document, and notes that it hallucinates some details. But I don't think he's anywhere near critical enough. The chatbot not only invents an entirely new plaintiff in a medical disciplinary order, it changes the name from "Laurie Beth Krueger" to "Latoya Jackson" in what seems to me like a pretty clear case of implicit bias that's built into these tools. Someone's being punished? Better generate a Black-sounding name!
- He uses text from a web page as an example of "unstructured" data that an LLM can extract. But... it's not unstructured! It's in HTML, which is the definition of structured! And it even has meaningful markup with descriptive class names! Just scrape the page!
I really started to think I was losing my mind near the end of the post, when he uploads a dataset and asks it to tell him "something interesting about this data." If you're not caught up in the AI bubble, the idea that any of these models are going to say "something interesting" is laughable. They're basically the warm, beige gunk that you have to eat when you get out of the Matrix.
More importantly, LLMs can't reason. They don't actually have opinions, or even a mental model of anything, because they're just random word generators. How is it supposed to know what is "interesting?" I know that Willison knows this, but our tendency to anthropomorphize these interactions is so strong that I think he can't help it. The ELIZA effect is a hell of a drug.
I don't really want to pick on Willison here — I think he's a much more moderate voice than this makes him sound. But the post is emblematic of countless pitch emails and conversations that I have in which these tools are presumed to be useful or interesting in a journalism context. And as someone who prides themself on producing work that is accurate, reliable, and accountable, the idea of adding a black box containing a bunch of randomized matrix operations in my process is ridiculous. That's to say nothing of the ecological impact that they have in aggregate, or the fact that they're trained on stolen data (including the work of fellow journalists).
I know what the responses to this will be, particularly for people who are using Copilot and other coding assistants, because I've heard from them when I push back on the hype: what's wrong with using the LLM to get things done? Do I really think that the answer to these kinds of problems should be "write code yourself" if a chatbot can do it for us? Does everyone really need to learn to scrape a website, or understand a file format, or use a programming language at a reasonable level of competency?
And I say: well, yes. That's the job.
But also, I think we need to be reframing the entire question. If the problem is that the pace and management of your newsroom do not give you the time to explore your options, build new skills, and produce data analysis on a reasonable schedule, the answer is not to offload your work to OpenAI and shortchange the quality of journalism in the process. The answer is to fix the broken system that is forcing you to cut corners. Comrades, you don't need a code assistant — you need a union and a better manager.
Of course your boss is thrilled that you're using an LLM to solve problems: that's easier than fixing the mismanagement that plagues newsrooms and data journalism teams, keeping us overworked and undertrained. Solving problems and learning new things is the actual fun part of this job, and it's mind-boggling to me that colleagues would rather give that up to the robots than to push back on their leadership.
Of course many managers are fine with output that's average at best (and dangerous at worst)! But why are people so eager to reduce themselves to that level? The most depressing tic that LLM users have is answering a question with "well, here's what the chatbot said in response to that" (followed closely by "I couldn't think of how to end this, so I asked the chatbot"). Have some self-respect! Speak (and code) for yourself!
Of course CEOs and CEO-wannabes are excited about LLMs being able to take over work. Their jobs are answering e-mails and trying not to make statements that will freak anyone out. Most of them could be replaced by a chatbot and nobody would even notice, and they think that's true of everyone else as well. But what we do is not so simple (Google search and Facebook content initiatives notwithstanding).
If you are a data journalist, your job is to be as correct and as precise as possible, and no more, in a world where human society is rarely correct or precise. We have spent forty years, as an industry niche, developing what Philip Meyer referred to as "precision journalism," in which we adapt the techniques of science and math to the process of reporting. I am begging you, my fellow practitioners, not to throw it away for a random token selection process. Organize, advocate for yourself, and be better than the warm oatmeal machine. Because if you act like you can be replaced by the chatbot, in this industry, I can almost guarantee that you will be.
January 17, 2024
Add It Up
A common misconception by my coworkers and other journalists is that people like me — data journalists, who help aggregate accountability metrics, find trends, and visualize the results — are good at math. I can't speak for everyone, but I'm not. My math background taps out around mid-level algebra. I disliked Calculus and loathed Geometry in high school. I took one math class in college, my senior year, when I found out I hadn't satisfied my degree requirements after all.
I do work with numbers a lot, or more specifically, I make computers work with numbers for me, which I suspect is where the confusion starts. Most journalists don't really distinguish between the two, thanks in part to the frustrating stereotype that being good at words means you have to be bad at math. Personally, I think the split is overrated: if you can go to dinner and split a check between five people, you can do the numerical part of my job.
(I do know journalists who can't split a check, but they're relatively few and far between.)
I've been thinking lately about ways to teach basic newsroom numeracy, or at least encourage people to think of their abilities more charitably. Certainly one perennial option is to do trainings on common topics: percentages versus percentage points, averages versus medians, or risk ratios. In my experience, this helps lay the groundwork for conversations about what we can and can't say, but it doesn't tend to inspire a lot of enthusiasm for the craft.
The thing is, I'm not good at math, but I do actually enjoy that part of my job. It's an interesting puzzle, it generally provides a finite challenge (as opposed to a story that you can edit and re-edit forever), and I regularly find ways to make the process better or faster, so I feel a sense of growth. I sometimes wonder if I can find equivalents for journalists, so that instead of being afraid of math, they might actually anticipate it a little bit.
Unfortunately, my particular inroads are unlikely to work very well for other people. Take trigonometry, for example: in A Mathematician's Lament, teacher Paul Lockhart describes trig as "two weeks of content [...] stretched to semester length," and he's not entirely wrong. But it had one thing going for it when I learned about sine and cosine, which was that they're foundational to projecting a unit vector through space — exactly what you need if you're trying to write a Wolf3D clone on your TI-82 during class.
Or take pixel shader art, which has captivated me for years. Writing code from The Book of Shaders inverts the way we normally think about math. Instead of solving a problem once with a single set of inputs, you're defining an equation that — across millions of input variations — will somehow resolve into art. I love this, but imagine pointing a reporter at Inigo Quilez's very cool "Painting a Character with Maths." It's impressive, and fun to watch, and utterly intimidating.
(One fun thing is to look at Quilez's channel and find that he's also got a video on "painting in Google Sheets." This is funny to me, because I find that working in spreadsheet and shaders both tend to use the same mental muscles.)
What these challenges have in common is that they appeal directly to my strengths as a thinker: they're largely spatial challenges, or can be visualized in a straightforward way. Indeed, the math that I have the most trouble with is when it becomes abstract and conceptual, like imaginary numbers or statistical significance. Since I'm a professional data visualization expert, this ends up mostly working out well for me. But is there a way to think about math that would have the same kinds of resonance for verbal thinkers?
So that's the challenge I'm percolating on now, although I'm not optimistic: the research I have been able to do indicates that math aptitude is tied pretty closely to spatial imagination. But obviously I'm not the only person in history to ask this question, and I'm hopeful that it can be possible to find scenarios (even if only on a personal level) that can either relate math concepts to verbal brains, or get them to start thinking of the problems in a visual way.
October 25, 2022
Semi-formal
An uncomfortable truth of modern web journalism is that most people only read the headlines. That's what happens when most of your interactions are mediated through social media, where the headline and a brief teaser surface in the share card, and then all the "fun" interaction is arguing about it in the responses.
There are sensible reactions to this (high on the list: stop letting the copy desk pick the headlines for stories they didn't report) and then there's the new wave of web publications (Politico Pro, Axios, and now Semafor) that have instead decided that the ideal strategy is to just write the story like a social media blurb anyway. From CJR:
Author bylines are, as promised, as prominent as headlines, but the meat of the Semaform concept comes in the text of the story itself, which is broken into distinct sections, each preceded by a capitalized subheading: “THE NEWS” (or “THE SCOOP”), offering the “undisputed facts” of a given story; “THE REPORTER’S VIEW,” which is what it sounds like, with an emphasis on “analysis”; “ROOM FOR DISAGREEMENT,” which is also what it sounds like; “THE VIEW FROM,” promising “different and more global perspectives” on the story in question; and “NOTABLE,” linking out to worthwhile related coverage from other outlets.
I don't consider myself a particularly old-fashioned news reader — I've spent most of my career trying to convince reporters and editors to get a little creative with their formats — but I admit to a visceral repulsion when I read these stories, maybe because they're so proscribed. They often feel, as Timothy Noah writes, so boiled down that they actually impede understanding. They can't be skimmed because there's nothing but skim there.
Even worse, the adherence to the fill-in-the-blanks writing formula (with its pithy, repetitive headers) does its best to drain any distinctiveness from the writers, even while it puts bylines front and center. Take, for example, this David Weigel piece on Oregon Democrats, which chafes deeply against the "Semaform." Weigel gives us 23 paragraphs that would not have been out of place in his Washington Post reporting, followed by a single paragraph of "David's View" (as if the previous reporting was not also his viewpoint), then a "Room for Disagreement" that... doesn't actually disagree with anything. And then "The View from the U.K.," which is a mildly amusing dunk on a British tabloid reporter but adds nothing to the story.
For a more "typical" example of the form, there's this story by Kadia Goba on Marjorie Taylor Greene's deranged anti-trans legislation. Goba is less of a "name," which may explain why her piece is less of a newspaper article with some additional sections jammed onto the end, but it still reads as if a normal inverted-pyramid piece had the subheads inserted at arbitrary locations. The final "View from the U.K." feels like twisting the knife: and now the news from TERF Island.
Here's the thing, to me: picking a story form like this is a great way to make sure nobody can ever remember a story an hour after reading it, because they all blend together. Why hire good journalists if you're not going to let them write? You're never going to get something like Lynda V. Mapes' adorable Rialto coverage in Semafor's article template. It doesn't make any sense for investigative writing. You're certainly not going to get the kinds of interactive or creative storytelling that I work on (although, given that Semafor's visual aesthetic is somewhere between "your dad made a Powerpoint meme" and "Financial Times circa 2008," I'm not sure they care).
Above all, these new outlets feel like a bet on a very specific future of news: one where it's very much a market commodity, as opposed to something that can be pleasurable or rewarding in itself. And maybe that's the right bet! I have my doubts, but my hit rate is no better than any other industry thinker, and I assume you wouldn't do something this joyless without a lot of market research indicating that you can sell it to somebody. But as someone who's been more and more convinced that the only sustainable path for journalism is non-profit, that person isn't me.
January 27, 2021
2020 Revision
The problem with developing election data expertise is that they make you cover elections.
Even as they go, this was a rough one, and I'm just now starting to feel like I've recovered. After getting through a grueling primary season, we ended up rewriting our entire general election rig — we've got a post on the NPR News Apps blog about it, which is a pretty good overview.
This wasn't my first election night. But it was one of the biggest development efforts and teams I've led in journalism, and obviously the stakes were high. In the end, I'm mostly satisfied with the work we did — there's always room for improvement. I think 2020 is a year I'll look back on in terms of the simple (our technical choices) and the complex (weighing our responsibility for the results).
Act, React
For the primaries, I wrote our results displays as a set of custom elements. That worked well: it was fast, expressive, and with a little work to smooth over the API (primarily adding support for automatic templating and attribute/property mirroring), it was a pretty pleasant framework. However, for the general election, I wanted to build out a single-page application that shared state across multiple views. I didn't have a ton of experience with React, and it seemed like a worthwhile experiment (technically, we used Preact, but it's the same thing in practice).
Turns out I didn't love the experience, but it did have advantages. HTML custom elements do not come with a templating solution built-in, and they don't have a good way to pass non-string data across element boundaries. I wrote a miniature "data to element mapping" function to make that process easier, but it was never as straightforward as JSX templates were. In general, React's render cycle is reasonably pleasant to use, and easy to train people on. It's clear that this is what the library was primarily designed to do.
Unfortunately, it often feels like React doesn't really know how to organize the non-rendering parts of a web application, and when you're building live election results those parts matter. Unlike Vue or custom elements, which separate updates to display and data, changes to a React component properties and state all get piped through the render cycle. This is a poor match for operations that don't easily map to an idempotent template value, like triggering a server fetch or handling focus for accessibility purposes.
As best I can tell, the React community's answer to that problem has been to double down on its fixation on stateless programming, switch to pure functions and "hooks" for rendering, and recommend the use of global stores like Redux to manage data for the application. Class-based components are clearly considered gauche, and JSX templating encourages only using syntax that can fit into a return value, instead of natural structures like loops and conditionals. At times, working with React feels like being trapped with that one brogrammer at a party who keeps telling you about the lambda calculus. We spent decades waiting for better JavaScript syntax features, and now React wants to pretend they don't exist? In this economy?
The best explanation I've seen of this philosphy is Rich Harris's talk "Metaphysics and JavaScript" (be sure to bring up the slide notes). I'm not sure Harris has the right solution either — the new syntax in his own Svelte framework gives me the willies — but when he talks about React in terms of an ideology, I think he's right. And I'm ideological as hell, but I'm also a practical person. If your framework keeps choosing an elegant abstraction over how the actual world works, it's not doing what I need it to do.
So, long story short, it works, and I think it's probably good enough to re-use for another four to eight years. But I went into the experience hoping to see if there was some hidden virtues of React that I just hadn't found, and largely I was disappointed.
Tough Calls
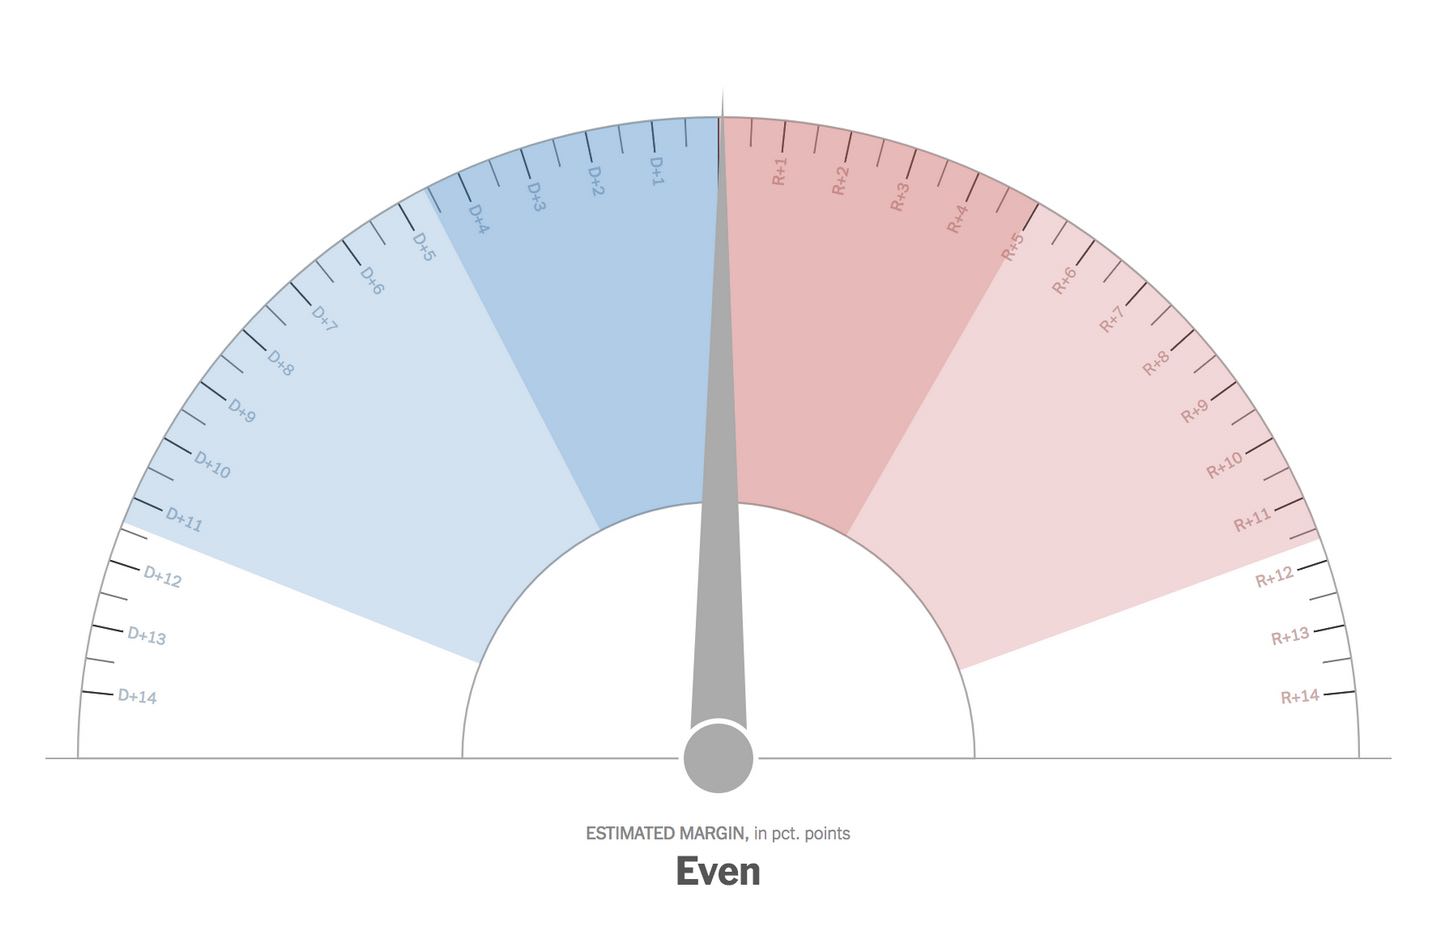
It was obvious to anyone paying the slightest bit of attention that Trump was not going to accept the results of this election if he didn't win, and that his supporters would absolutely be flooding the country with misinformation about it. He'd done it before: in 2016, among other lies, he handed out misleading maps to try to persuade visitors that he had actually won the popular vote and the majority of the country.
But five days before that report surfaced, as usual having utterly failed to read the room, the New York Times had published a largely identical map, effectively pre-validating Trump's choice. Much like Trump's 2020 strategy, this shouldn't have been hard to predict: a map of vote margin by precinct is considered wildly misleading by data visualization experts, and right-wing operatives have consistently overemphasized the mostly-empty land mass that makes up "real America" when they're working the refs. If newsrooms themselves don't understand (or care) how their visual reporting contributes to misinformation, how can we expect voters to differentiate between journalism and lies?
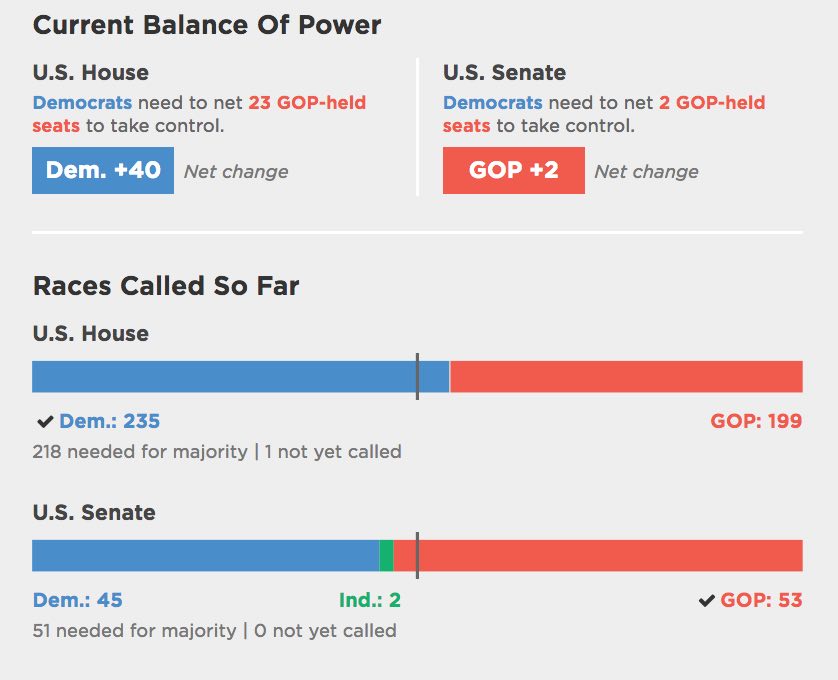
My worst nightmare, going into 2020, was that Trump or someone in his orbit would use our reporting to try to illegally retain power. So we planned for uncertainty. We had a big note at the top of the page to warn readers that mail-in voting could delay results. We didn't mark races as "leading" on any displays until they hit 50% of votes in, to reduce the well-known red-to-blue shift from vote tabulation. We built new displays to emphasize electoral weight over geographic size. And behind the scenes, I built additional overrides into the pipeline just to be safe: although we never used them, there was a whole facility for flagging races with arbitrary metadata that could have been used for legal challenges or voting irregularities.
(In fact, if I can offer one bit of advice to anyone who's new to election results, it's to be extremely pessimistic about the things you might need to override. Since this wasn't my first rodeo, I had control sheets already set up that would let us reset candidate metadata, ballot rosters, and race calls. Sure enough, when Maine's public radio stations wanted long-shot independent candidates included to highlight their impact on ranked-choice voting for Susan Collins' seat, despite not clearing our vote threshold for display, it was just a matter of updating a few cells. Same for when data irregularities muddled the district results coming from those states that proportionally allocate their electoral votes.)
I honestly wanted to go further with our precautions, but I'm satisfied with what we got approved in a fairly traditional newsroom. And in the end, we got lucky: it wasn't actually that close. Biden won by the same electoral margin that Trump had won in 2016, and across enough states by a high enough margin that it couldn't be flipped with a single lawsuit (even assuming Trump's lawyers were competent which... was not the case).
So the good news was that we didn't have to worry about NPR results being posted to Trump's Twitter feed. The bad news, as you know, is that the losers of the election spent the next two months undermining those results, lying about illegal voting, and eventually inciting a riot by white supremacists and QAnon conspiracy theorists at the Capitol during final certification of the electoral college. Kind of a mixed bag.
No, this election wasn't like any other. However, I hope it serves as a chance for all of us who do this work to think carefully about what our role is, and how we use the power we've been given. I have long argued that real-time election results are a civic disaster — they're stressful, misleading, and largely pointless — but that ship has sailed, and like a hypocrite I cash the checks for building them regardless. In the era of The Needle, news organizations aren't going to give up the guaranteed traffic boost no matter how unhealthy it is for the country. At the very least we can choose to design responsibly, and prioritize more than "faster results" and "stickier pages." We're not big on long-term lessons in this industry, but we have to start somewhere.
March 21, 2019
Reporting through the Scramble Suit
A proposal for responsible and ethical publication of personally-identifiable information in data journalism
Thanks to Helga Salinas, Kazi Awal, and Audrey Carlsen for their feedback.
Introduction
Over the last decade, one of the goals of data journalism has been to increase accountability and transparency through the release of raw data. Admonitions of "show your work" have become common enough that academics judge our work by the datasets we link to. These goals were admirable, and (in the context of legitimizing data teams within legacy organizations) even necessary at the time. But in an age of 8chan, Gamergate, and the rise of violent white nationalism, it may be time to add nuance to our approach.
This document is concerned primarily with the publication of personal data (also known as personally-identifiable information, or PII). In other words, we're talking about names, addresses or contact info, lat/long coordinates and other geodata, ID numbers (including license plates or other government ID), and other data points that can be traced back to a single individual. Much of this is available already under the public record, but that's no excuse: as the NYT Editorial Board wrote in 2018, "just because information is public doesn't mean it has to be so easy for so many people to get." It is irresponsible to amplify information without thinking about what we're amplifying and why.
Moreover, this is not a theoretical discussion: many newsroom projects start with large-scale FOIA dumps or public databases, which may include exactly this personal data. There have been movements in recent years to monetize these databases--creating a queryable database of government salaries, for example, and offering it via a subscription. Even random public records requests may disclose personal data. Intentionally or not, we're swimming in this stuff, and have become jaded as to its prevalence. I simply ask: is it right for us to simply push it out, without re-examining the implications of doing so?
I would stress that I'm not the only person who has thought about these things, and there are a few signs that we as an industry are beginning to formalize our thought process in the same way that we have standards around traditional reporting:
- The Markup's ethics policy contains guidelines on personal data, including a requirement to set an expiration date (after which point it is deleted).
- Reveal's ethics guide doesn't contain specific data guidelines, but does call out the need to protect individual privacy: "Recognize that private people have a greater right to control information about themselves than do public officials and others who seek power, influence or attention. Only an overriding public need can justify intrusion into anyone's privacy."
- The New York Times ran a session at NICAR 2019 on "doxxing yourself," in part to raise awareness of how vulnerable reporters (and by extension, readers) may be to targeted harassment and tracking.
- A 2016 SRCCON session on "You're The Reason My Name Is On Google: The Ethics Of Publishing Public Data" explored real-world lessons from the Texas Tribune's salary databases (transcript here).
Why the concern?
In her landmark 2015 book The Internet of Garbage, Sarah Jeong sets aside an entire chapter just for harassment. And with good reason: the Internet has enabled new innovations for old prejudices, including SWATting, doxing, and targeted threats at a new kind of scale. Writing about Gamergate, she notes that the action of its instigator, Eron Gjoni, "was both complicated and simple, old and new. He had managed to crowdsource domestic abuse."
I choose to talk about harassment here because I think it provides an easy touchstone for the potential dangers of publishing personal information. Since Latanya Sweeney's initial work on de-anonymizing data, an entire industry has grown up around taking disparate pieces of information, both public and private, and matching them against each other to create alarmingly-detailed profiles of individual people. It's the foundation of the business model for Facebook, as well as a broad swathe of other technology companies. This information includes your location over time. And it's available for purchase, relatively cheaply, by anyone who wants to target you or your family. Should we contribute, even in a minor way, to that ecosystem?
These may seem like distant or abstract risks, but that may be because for many of us, this harassment is more distant or abstract than it is for others. A survey of "news nerds" in 2017 found that more than half are male, and three-quarters are white (a demographic that includes myself). As a result of this background, many newsrooms have a serious blind spot when it comes to understanding how their work may be seen (or used against) underrepresented populations.
As numerous examples have shown, we are very bad as an industry at thinking about how our power to amplify and focus attention is used. Even if harassment is not the ultimate result, publishing personal data may be seen by our audience as creepy or intrusive. At a time when we are concerned with trust in media, and when that trust is under attack from the top levels of government, perhaps we should be more careful in what data we publish, and how.
Finally, I think it is useful to consider our twin relationship to power and shame. Although we don't often think of it this way, the latter is often a powerful tool in our investigative reporting. After all, as the fourth estate, we do not have the power to prosecute or create legislation. What we can do is highlight the contrast between the world as we want it to be and as it actually is, and that gulf is expressed through shame.
The difference between tabloid reporting and "legitimate"journalism is the direction that shame is directed. The latter targets its shame toward the powerful, while the former is as likely to shame the powerless. In terms of accountability, it orients our power against the system, not toward individual people. It's the difference between reporting on welfare recipients buying marijuana, as opposed to looking at how marijuana licensing perpetuates historical inequalities from the drug war.
Our audiences may not consciously understand the role that shame plays in our journalism, but they know it's a part of the work. They know we don't do investigations in order to hand out compliments and community service awards. When we choose to put the names of individuals next to our reporting, we may be doing it for a variety of good reasons (perhaps we worked hard for that data, or sued to get it) but we should be aware that it is often seen as an implication of guilt on the part of the people within.
Potential guidelines for public release of PII
I want to be very clear that I am only talking about the public release of data in this document. I am not arguing that we should not submit FOIA or public records requests for personal data, or that it can't be useful for reporting. I'm also not arguing that we should not distribute this data at all, in aggregated form, on request, or through inter-organizational channels. It is important for us to show our work, and to provide transparency. I'm simply arguing that we don't always need to release raw data containing personal information directly to the public.
In the spirit of Maciej Ceglowski's Haunted by Data, I'd like to propose we think of personal data in three escalating levels of caution:
Don't collect it!
When creating our own datasets, it may be best to avoid personal data in the first place. Remember, you don't have to think about the implications of the GDPR or data leaks if you never have that information. When designing forms for story call-outs, try to find ways to automatically aggregate or avoid collecting information that you're not going to use during reporting anyway.
Don't dump it!
If you have the raw data, don't just throw it out into the public eye because you can. In general, we don't work with raw data for reporting anyway: we work with aggregates or subsets, because that's where the best stories live. What's the difference in policy effects between population groups? What department has the widest salary range in a city government? Where did a disaster cause the most damage? Releasing data in an aggregate form still allows end-users to check your work or perform follow-ups. And you can make the full dataset available if people reach out to you specifically over e-mail or secure channels (but you'll be surprised how few actually do).
Don't leave it raw!
In cases where distributing individual rows of data is something you're committed to doing, consider ways to protect the people inside the data by anonymizing it, without removing its potential usefulness. For example, one approach that I love from ProPublica Illinois' parking ticket data is the use of one-way hash functions to create consistent (but anonymous) identifiers from license plates: the input always creates the same output, so you can still aggregate by a particular car, but you can't turn that random-looking string of numbers and letters back into an actual license plate. As opposed to "cooking" the data, we can think of this as "seasoning" it, much as we would "salt" a hash function. A similar approach was used in the infosec community in 2016 to identify and confirm sexual abusers in public without actually posting their names (and thus opening the victims up to retaliation).
Toward a kinder, more empathic data journalism
Once upon a time, this industry thought of computer-assisted reporting as a new kind of neutral standard: "precision" or "scientific" journalism. Yet as Catherine D'Ignazio and Lauren Klein point out in Data Feminism, CAR is not neutral, and neither is the way that the underlying data is collected, visualized, and distributed. Instead, like all journalism, it is affected by concerns of race, gender, sexual identity, class, and justice.
It's my hope that this proposal can be a small step to raise the profile of these questions, particularly in legacy newsrooms and journalism schools. In working on several projects at The Seattle Times and NPR, I was surprised to find that although there are guidelines on how to ethically source and process data, it was difficult to find formal advice on ethical publishing of that same data. Other journalists have certainly dealt with this, and yet there are relatively few documents that lay out concrete guidelines on the matter. We can, and should, change that.
December 14, 2018
Lightning Power
This post was originally written as a lightning talk for SRCCON:Power. And then I looked at the schedule, and realized they weren't hosting lightning talks, but I'd already written it and I like it. So here it is.
I want to talk to you today about election results and power.
In the last ten years, I've helped cover the results for three newsrooms at very different scales: CQ (high-profile subscribers), Seattle Times (local), and NPR (shout out to Miles and Aly). I say this not because I'm trying to show off or claim some kind of authority. I'm saying it because it means I'm culpable. I have sinned, and I will sin again, may God have mercy on my soul.
I used to enjoy elections a lot more. These days, I don't really look forward to them as a journalist. This is partly because the novelty has worn off. It's partly because I am now old, and 3am is way past my bedtime. But it is also in no small part because I'm really uncomfortable with the work itself.
Just before the midterms this year, Tom Scocca wrote a piece about the rise of tautocracy — meaning, rule by mulish adherence to the rules. Government for its own sake, not for a higher purpose. When a judge in Nebraska rules that disenfranchising Native American voters is clearly illegal, but will be permitted under regulations forbidding last-minute election changes — even though the purpose of that regulation is literally to prevent voter disenfranchisement — that's tautocracy. Having an easy election is more important than a fair one.
For those of you who have worked in diversity and inclusion, this may feel a little like the "civility" debate. That's not a coincidence.
I am concerned that when we cover elections with results pages and breaking alerts, we're more interested in the rules than we are in the intended purpose. It reduces the election to the barest essence — the score, like a football game — divorced from context or meaning. And we spend a tremendous amount of redundant resources across the industry trying to get those scores faster or flashier. We've actually optimized for tautocracy, because that's what we can measure, and you always optimize for your metrics.
But as the old saying goes, elections have consequences. Post-2016, even the most privileged and most jaded of us have to look around at a rising tide of white nationalism and ask, did we do anything to stop this? Worse, did we help? That's an uncomfortable question, particularly for those of us who have long believed (incorrectly, in my opinion) that "we just report the news."
Take another topic, one that you will be able to sell more easily to your mostly white, mostly male senior editors when you get back: Every story you run these days is a climate change story. Immigration, finance, business, politics both internal and domestic, health, weather: climate isn't just going to kill us all, it also affects nearly everything we report on. It's not just for the science stories in the B section anymore. Every beat is now the climate beat.
Where was climate in our election dashboard? Did anyone do a "balance of climate?"
How will electoral power be used? And against who?
Isn't that an election result?
What would it look like if we took the tremendous amount of duplicated effort spent on individual results pages, distributed across data teams and lonely coders around the country, and spent it on those kinds of questions instead?

The nice thing about a lightning talk is that I don't have time to give you any answers. Which is good, because I'm not smart enough to have any. All I know is that the way we're doing it isn't good enough. Let's do better.
Thank you.
[SPARSE, SKEPTICAL APPLAUSE]
September 24, 2018
The Best of Times
About two months ago, just before sneaking out the back door so that nobody in the newsroom would try to do one of those mortifying "everyone clap for the departing colleague" routines, I sent a good-bye e-mail to the Seattle Times newsroom. It read, in part:
I'm deeply grateful to Kathy Best, who made the Interactives team possible in 2014. Kathy doesn't, I think, get enough credit for our digital operation. She was always the first to downplay her expertise in that sphere, not entirely without reason. Yet it is hard to imagine The Seattle Times taking a risk like that anymore: hiring two expensive troublemakers with incomprehensible, oddball resumes for a brand-new team and letting them run wild over the web site.
It was a gamble, but one with a real vision, and in this case it paid off. I'm proud of what we managed to accomplish in my four years here on the Interactives team. I'm proud of the people that the team trained and sent out as ambassadors to other newsrooms, so that our name rings out across the country. And I'm proud of the tools we built and the stories we told.
When I first really got serious about data journalism, the team to beat (ironically enough, now that I've moved to the Windy City) was the Chicago Tribune. It wasn't just that they did good work, and formalized a lot of the practices that I drew on at the Times. It was also that they made good people: ex-Trib folks are all over this industry now, not to mention a similar impact from the NPR visuals team that formed around many of the same leaders a few years later. I wanted to do something similar in Seattle.
That's why there was no better compliment, to my ears, than when I would talk to colleagues at other newsrooms or organizations and hear things like "you've built a pretty impressive alumni network" or "the interns you've had are really something." There's no doubt we could have always done better, but in only four years we managed to build a reputation as a place that developed diverse, talented journalists. People who were on or affiliated with the team ended up at the LA Times, San Francisco Chronicle, Philadelphia Inquirer, New York Times, and Pro Publica. We punched above our weight.
I never made a secret of what I was trying to do, but I don't think it ever really took hold in the broader organizational culture. That's a shame: turnover was high at the Seattle Times in my last couple of years there, especially after the large batch of buyouts in early 2017. I still believe that a newsroom that sees departures as an essential tool for recruiting and enriching the industry talent pool would see real returns with just a few simple adjustments.
My principles on the team were not revolutionary, but I think they were effective. Here are a few of the lessons I learned:
- Make sacrifices to reward high performers. Chances are your newsroom is understaffed and overworked, which makes it tempting to leave smart people in positions where they're effective but unchallenged. This is a mistake: if you won't give staff room to grow, they'll leave and go somewhere that will. It's worth taking a hit to efficiency in one place in order to keep good employees in the room. If that means cutting back on some of your grunt work — well, maybe your team shouldn't be doing that anyway.
- Share with other newsrooms as much as possible. You don't get people excited about working for your paper by writing a great job description when a position opens up. You do it by making your work constantly available and valuable, so that they want to be a part of it before an opening even exists. And the best way to show them how great it is to work for you is to work with them first: share what you've learned, teach at conferences, open-source your libraries. Make them think "if that team is so helpful to me as an outsider..."
- Spread credit widely and generously. As with the previous point, people want to work in places where they'll not only get to do cool work out in the open, they'll also be recognized for it. Ironically, many journalists from underrepresented backgrounds can be reluctant to self-promote as aggressively as white men, so use your power to raise their profile instead. It's also huge for retention: in budget cut season, newsroom managers often fall back on the old saw that "we're not here for the money." But we would do well to remember that it cuts both ways: if someone isn't working in a newsroom for the money, it needs to be rewarding in other ways, as publicly as possible.
- Make every project a chance to learn something new. This one is a personal rule for me, but it's also an important part of running a team. A lot of our best work at the Times started as a general experiment with a new technology or storytelling technique, and was then polished up for another project. And it means your team is constantly growing, creating the opportunity for individuals to discover new niches they can claim for their own.
- Pair experienced people and newcomers, and treat them both like experts. When any intern or junior developer came onto the Interactives team, their first couple of projects would done in tandem with me: we'd walk through the project, set up the data together, talk about our approach, and then code it as a team. It meant taking time out of my schedule, but it gave them valuable experience and meant I had a better feel for where their skills were. Ultimately, the team succeeds as a unit, not as individuals.
- Be intentional and serious about inclusive hiring and coverage. It is perfectly legal to prioritize hiring people from underrepresented backgrounds, and it cannot be a secondary consideration for a struggling paper in a diverse urban area. Your audience really does notice who is doing the writing, and what they're allowed to write about. One thing that I saw at the Times, particularly in the phenomenal work of the video team, was that inclusive coverage would open up new story leads time and time again, as readers learned that they could trust certain reporters to cover them fairly and respectfully.
In retrospect, all of these practices seem common-sense to me — but based on the evidence, they're not. Or perhaps they are, but they're not prioritized: a newspaper in 2018 has tremendous inertia, and is under substantial pressure from inside and out. Transparent management can be difficult — to actively celebrate the people who leave and give away your hard work to the community is even harder. But it's the difference between being the kind of team that grinds people down, or polishes them to a shine. I hope we were the latter.
February 14, 2017
Quantity of Care
We posted Quantity of Care, our investigation into operations at Seattle's Swedish-Cherry Hill hospital, on Friday. Unfortunately, I was sick most of the weekend, so I didn't get a chance to mention it before now.
I did the development for this piece, and also helped the reporters filter down the statewide data early on in their analysis. It's a pretty typical piece design-wise, although you'll notice that it re-uses the watercolor effect from the Elwha story I did a while back. I wanted to come up with something fresh for this, but the combination with Talia's artwork was just too fitting to resist (watch for when we go from adding color to removing it).
I did investigate one change to the effect, which was to try generating the desaturated artwork on the client, instead of downloading a heavily-compressed pattern image. Unfortunately, doing image processing in JavaScript is too heavy on the main thread, and I didn't have time to investigate moving it into a worker. I'd also like to try doing it from a WebGL shader in the future, since I suspect that's actually the best way to get it done efficiently.
In the end, I'm just happy to have worked on something that feels like such an important, powerful investigative story.
January 17, 2017
Catch Up, 2016
2016 was a busy year for interactive projects at The Seattle Times. According to our (very informal) spreadsheet, we did about 72 projects this year, about half of which were standalone. That number surprised me: at the start of the year, it felt like we were off to a slow start, but the final total isn't markedly lower than 2015, and some of those pieces were ambitious.
The big surprise of the year was Under Our Skin, a video project started by four young women in the newsroom and done almost completely under the radar. The videos themselves examine a dozen charged terms, particularly in a Seattle context, and there's a lot of smart little choices that the team made in this, such as the clever commenting prompts and the decision not to identify the respondents inline (so as not to invite pre-judgement). The editing is also fantastic. I pitched in a little on the video code and page development, and I've been working on the standalone versions for classroom use.
Perhaps the most fun projects to work on this year were with reporter Lynda Mapes, who covers environmental issues and tribal affairs for the Times. The Elwha: Roaring back to life report was a follow-up on an earlier, prize-winning look at one of the world's biggest dam removal projects, and I wrote up a brief how-to on its distinctive watercolor effects and animations. Lynda and I also teamed up to do a story on controversial emergency construction for the Wolverine fire, which involved digging through 60GB of governmental geospatial data and then figuring out how to present it to the reader in a clear, accessible fashion. I ended up re-using that approach, pairing it with SVG illustrations, for our ST3 guide.
SVG was a big emphasis for this year, actually. We re-used print assets to create a fleet of Boeing planes for our 100-year retrospective, output a network graph from Gephi to create a map of women in Seattle's art scene, and built a little hex map for a story on DEA funding for marijuana eradication. I also ended up using it to create year-end page banners that "drew" themselves, using Jake Archibald's animation technique. We also released three minimalist libraries for working with SVG: Savage Camera, Savage Image, and Savage Query. They're probably not anything special, but they work around the sharp edges of the elements with a minimal code footprint.
Finally, like much of the rest of the newsroom, our team got smaller this year. My colleague Audrey is headed to the New York Times to be a graphics editor. It's a tremendous next step, and we're very proud of her. But it will leave us trying to figure out how to do the same quality of digital work when we're down one newsroom developer. The first person to say that we just need to "do more with less" gets shipped to a non-existent foreign bureau.
October 28, 2016
How I built the ST3 guide
On election day, voters in the Seattle metro area will need to choose whether or not to approve Sound Transit 3, a $54 billion funding measure that would add miles of light rail and rapid bus transit to the city over the next 20 years. It's a big plan, and our metro editor at the paper wanted to give people a better understanding of what they'd be voting on. So I worked with Mike Lindblom, the Times' transportation reporter, and Kelly Shea in our graphics department to create this interactive guide (source code).
The centerpiece of the guide is the system map, which picks out 12 of the projects that will be funded by ST3. As you scroll through the piece, each project is highlighted, and it zooms to fill the viewport. These kinds of scrolling graphics have become more common in journalism, in part because of the limitations of phone screens. When we can't prompt users to click something with hover state and have limited visual real estate, it's useful to take advantage of the most natural verb they'll have at their fingertips: scroll. I'm not wild about this UI trend, but nobody has come up with a better method yet, and it's relatively easy to implement.
The key to making this map work is the use of SVG (scalable vector graphics). SVG is the unloved stepchild of browser images — badly-optimized and only widely supported in the last few years — but it has two important advantages. First, it's an export option in Illustrator, which means that our graphics team (who do most of their work in Illustrator) can generate print and interactive assets at the same time. It's much easier to teach them how to correctly add the metadata I need in a familiar tool than it is to teach the artists an entirely new workflow, especially on a small staff (plus, we can use existing assets in a new way, like this Boeing retrospective that repurposed an old print spread).
Second, unlike raster graphic formats like JPG or PNG, SVG is actually a text-based format that the browser can control the same way that it does the HTML document. Using JavaScript and CSS, it's possible to restyle specific parts of the image, manipulate their position or size, or add/remove shapes dynamically. You can even generate them from scratch, which is why libraries like D3 have been using SVG to do data visualization for years.
Unfortunately, while these are great points in SVG's favor, there's a reason I described it in my Cascadia talk as a "box full of spiders." The APIs for interacting with parts of the SVG hierarchy are old and finicky, and they don't inherit improvements that browsers make to other parts of the page. As a way of getting around those problems, I've written a couple of libraries to make common tasks easier: Savage Query is a jQuery-esque wrapper for finding and restyling elements, and Savage Camera makes it easy to zoom and pan around the image in animated sequences. After the election, I'm planning on releasing a third Savage library, based on our <svg-map> elements, for loading these images into the page asynchronously (see my writeup on Source for details).
The camera is what really makes this map work, and it's made possible by a fun property of SVG: the viewBox attribute, which defines the visible coordinate system of a given image. For example, here's an SVG image that draws a rectangle from [10,10] to [90,90] inside of a 100x100 viewbox:
If we want to zoom in or out, we don't need to change the position of every shape in the image. Instead, we can just set the viewbox to contain a different set of coordinates. Here's that same image, but now the visible area goes from [0,0] to [500,500]:
Savage Camera was written to make it easy to manipulate the viewbox in terms of shapes, not just raw coordinates. In the case of the ST3 guide, each project description shares an ID with a group of shapes. When the description scrolls into the window, I tell the camera to focus on that group, and it handles the animation. SVG isn't very well-optimized, so on mobile this zoom is choppier than I'd like. But it's still way easier than trying to write my own rendering engine for canvas, or using a slippy map library like Leaflet (which can only zoom to pre-determined levels).
This is not the first time that I've built something on this functionality: we've also used it for our Paper Hawks and for visualizing connections between Seattle's impressive women in the arts. But this is the most ambitious use so far, and a great chance to practice working closely with an illustrator as the print graphic was revised and updated. In the future, if we can polish this workflow, I think there's a lot of potential for us to do much more interesting cross-media illustrations.
